

U.S. Equities Are Crushing International Equites
Being diversified (within equities) is a good thing for your portfolio, right?

TL;DR
International stock markets have markedly underperformed the U.S. equity markets in recent years. While you should of course diversify, you may be shocked to discover just how much the U.S. stock market has outperformed and the impact it may have had on the performance of your portfolio recently.
Brief Diversification Overview
The concept of portfolio diversification is extremely ubiquitious in finance. Do not put all your eggs in one basket and invest across various asset classes both domestically and internationally. Historically investors with an average risk tolerance might invest in a ‘60/40’ portfolio consisting of a 60% allocation to equities and a 40% allocation to bonds:

Many years ago institutional investors began shifting money to alternative investments such as private equity, real estate and hedge funds. These investors are likely well diversified across both asset classes and regions. For the purposes of this blog post, I am going to focus on retail investors or non-accredited investors, two terms that are sometimes used interchangably, and refers to unsophisticated investors that primarily invest in stocks or bonds.
Diversifying Was Great…Before 1989
U.S. stocks have massively outperformed the rest of the world since the peak of the Japan bubble in 1989. $10k invested in international stocks in 1989 is now worth $43,602, representing a CAGR of 4.58%:

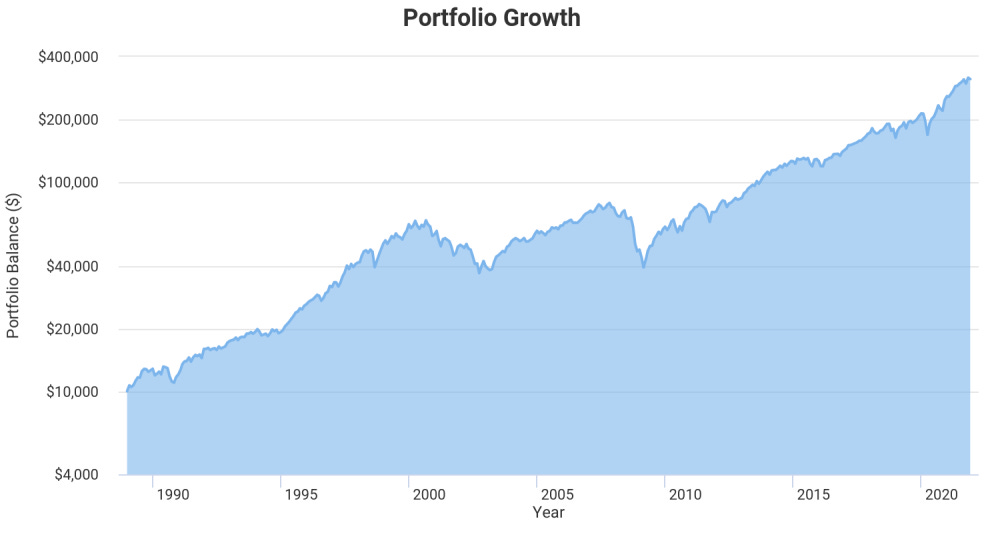
$10k invested in U.S. stocks is now worth $312,585, representing a CAGR of 11.02%:
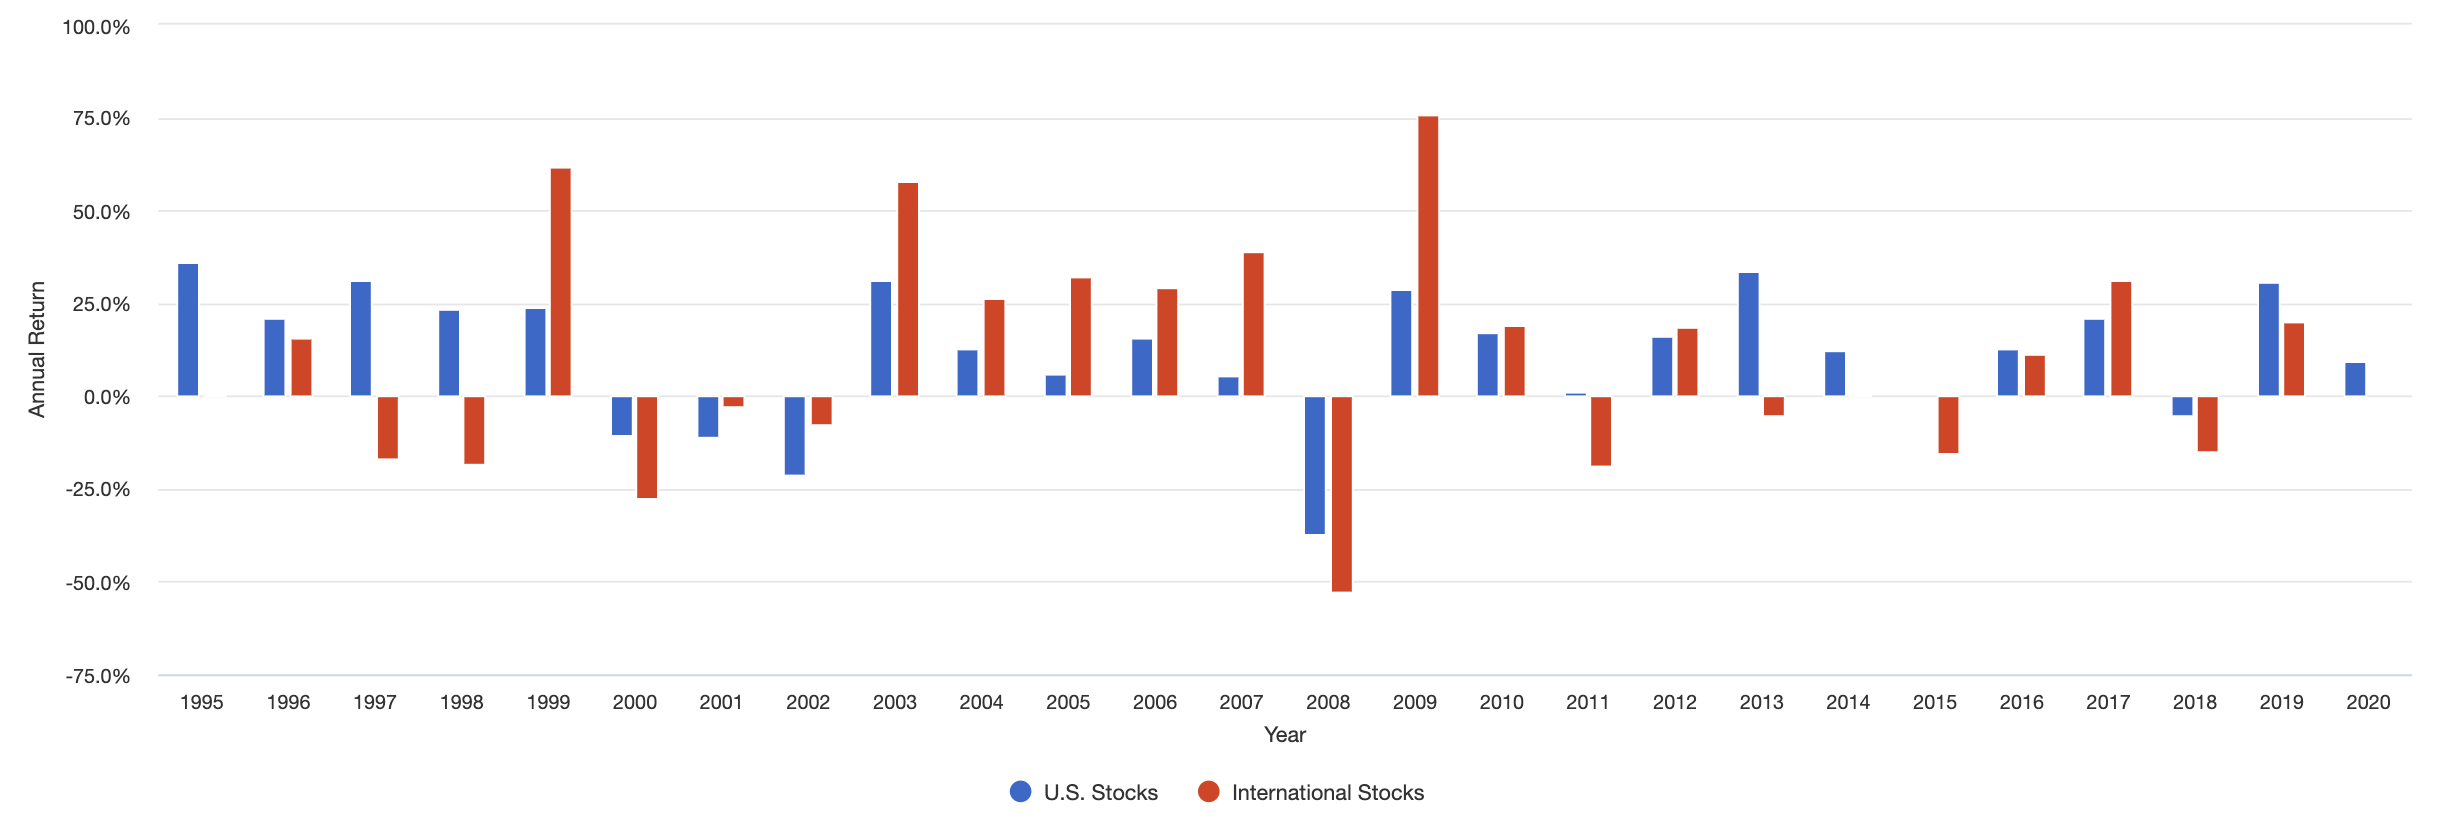
There has been however some years of international outperformance in 1986-1988, 1993, 1999, 2002-2007, 2012, and 2017 as highlighed below (red=international stocks):
According to an informative study released in March 2021 about valuation changes in the market, titled The Long Run Is Lying to You, by AQR Capital Management, an investment manager based in Connecticut, from 1980 to 2020 the U.S. outperformed the EAFE by 2.1% per annum. EAFE is a popular index that is comprised of companies from developed, international countries ex U.S. such Australia, Japan and western Europe.
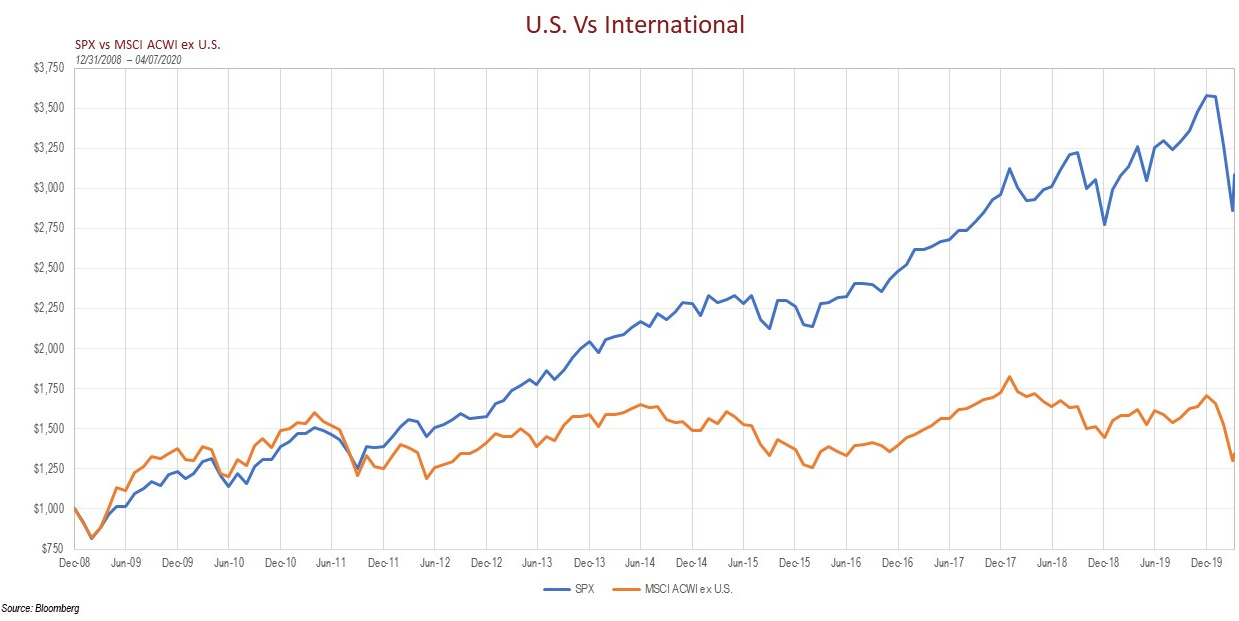
The outperformance is even greater between 2009-2020. Russell Investments wrote an article in in May 2020 asking if global diversification was even worth it given the U.S.’s recent outperformance. The firm notes that the MSCI All_Country World Index ex-U.S. (similar to the EAFE but also includes developing markets) barely eeked out a positive return while S&P 500 achieved an annual average return of 13.6% during this time frame:
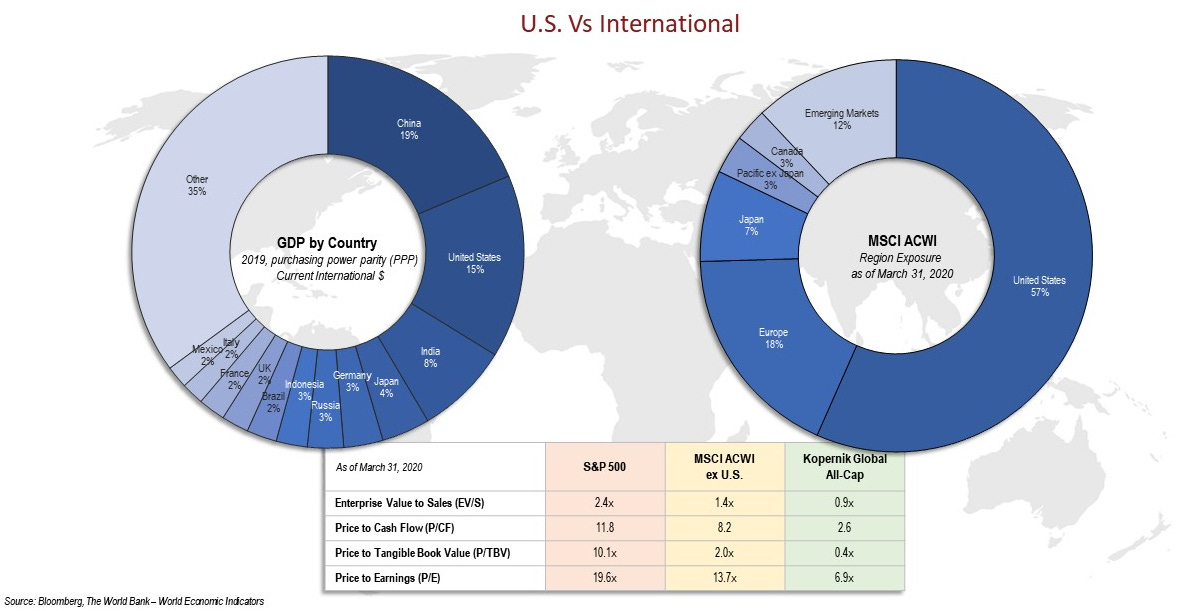
The Russell Investments article also noted that the outperformance has created a large discrepancy between the weighting of U.S. stocks in the MSCI All-Country World Index relative to how much U.S. accounted for global GDP. The U.S. only accounts for 15% of the world economy yet it’s weighting in the MSCI All-Country World Index was 57% at time of article’s writing:
Interestingly, many investors tend to overallocate their portfolios to domestic equities. The term for this is Home Bias. This article from Investopedia has a good definition of home bias:
Home bias is the tendency for investors to invest the majority of their portfolio in domestic equities, ignoring the benefits of diversifying into foreign equities.
Meb Faber, co-founder and the Chief Investment Officer of Cambria Investment Management, and author of multiple books, has been vocal about the importance of diversification. He composed a popular Twitter thread in 2019 about this subject. Faber noted that the U.S. made up 52% of the global market capitalization (it is now 61.5% as of 11/30/2021). This means that investors (at the time of writing) should weight ~1/2 their portfolio to the U.S.:


Yet many countries demonstrate strong home bias. Interestingly some countries like Canada, Australia and Japan demonstrate more extreme home bias compared to the U.S.. This is evidenced by investors in these countries a having higher domestic equity allocation relative to their country’s contribution to global GDP as compared to the U.S.:

Faber’s argument makes economic sense - investors that want to be diversified should allocate assets to a country/region based on that country/region’s global stock market weight. Fortunately U.S. investors, who on overage, allocate 80% of their assets to the U.S., have been achieving higher returns in recent years due to their home country bias.
Why do some investors exhibit Home Bias? The Investopedia article referenced above lists a few reasons:
Transaction costs - too expensive
Inaccessibility - difficult to purchase
Unfamiliarity with foreign equities - companies listed in foreign countries are harder to follow
Reasons to Diversify
Why are we told to diversify? All else equal, the more diversified you are, the lower chance that your portfolio substantially decline in value. Many articles are written on this subject including this one from Vanguard. A few of other reasons include:
Economic growth - certain parts of the world are growing faster especially developing countries. These faster growing regions should exhibit higher stock market returns.
Correlation - as long as foreign markets are not 100% correlated to the domestic stock market then exposure to foreign markets helps balance out volatility
Wider range of investment options - there may be more opportunities in international markets that are not available in domestic markets
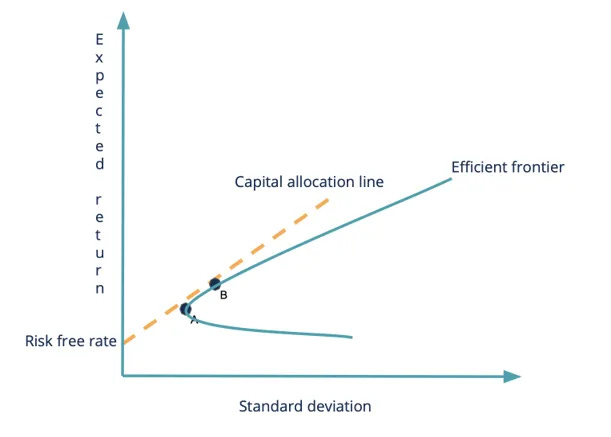
Academically it makes sense too. The concept of Modern Portfolio Theory (MPT), developed by Harry Markowitz, winner of The Nobel Memorial Prize in Economic Sciences, states that investors can maximize expected returns for any given level of risk by diversifying. According to MPT, every possible combination of risky assets can be plotted based on the risk-expected return. Risk is defined as the volatility of returns and is a function of the correlations between asset pairs. The entire set of possible portfolios is illustrated by a hyperbola, or smoothed curve. The efficient frontier is the area that investors will focus on; it is defined as the positively sloped portion of the hyperbola starting from point A in the graph below. The efficient frontier illustrates the best possible expected return for any given level of risk:
Why the U.S. Stock Market Has Been Outperforming
After discussing how U.S. stocks have outperformed, let’s dig into the why U.S. stocks have been outperforming. The three biggest factors are:
Valuations for U.S. stocks increasing over time
The rise of U.S. big tech in the previous decade 2010-2020
U.S. stock indices are market cap weighted and disproportionately (albeit positively) drove a lot of the performance
Valuations for U.S. Stocks Increasing Over Time
Going back to the article referenced previously by AQR Capital Management, the firm studied the returns for the S&P 500 from 1950-2020. They performed a regression analysis to determine how much annual excess returns (excess return = return on stocks minus the risk free rate) is attributed to changes in valuation, and not due to starting yield or realized earnings. The regression equation is:
S&P 500 Return = 5.2% + 0.95 * change in valuation
AQR utilized the Shiller CAPE to measure valuation. The CAPE, created by American economist Robert Shiller, stands for the cyclically adjusted price-to-earnings ratio, and is calculated as price divided by the average of 10 years of earnings. CAPE arguably preferable to the simple P/E ration because it smoothes out the impact of business cycles by looking at 10 years of earnings. A higher CAPE, similar to a higher P/E ratio, all else equal, would typically imply lower than average returns.
AQR noted that actual average excess return of the S&P 500 during the 1950-2020 timeframe was 6.5%. Since regression analysis has a y-intercept of 5.2%, this means the CAPE must have gone up during this time frame and accounts for the extra 130 basis points of return per annum. AQR provides the below graph highlighting how between 1979 to 2020, the USA CAPE rose from 10.9 to 34.5 and the ratio of U.S. CAPE to EAFE CAPE hit an all time high of 180%. The divergence in valuations between US and international is quite striking:

J.P Morgan puts out a quarterly update on called Guide to the Markets that also confirms that the current CAPE, as of 9/30/2021, remains historically elevated at 36.96. The forward P/E of 20.31x was also one standard deviation above the 25-year average forward P/E ratio of 16.78x:

Not only has the CAPE dramatically increased, but the value spread, defined by AQR below has also increased:
Value spread is the ratio of the book/price of cheap stocks over the book/price of expensive stocks
The concept of the value spread ties into the Fama-French three-factor model. Developed in 1992, the model was developed as a system to evaluate stock market returns. One of the factors is High Minus Low (HML), or the value premium. According to the Fama-French three-factor model, value stocks, or companies with high book-to-market ratios, outperform companies growth stocks, or companies with lower book-to-market ratios. The findings from AQR however paint a very different picture, with ratio of the cheap stocks to expensive stocks increasing over time:

Outperformance of U.S. Big Tech in 2010-2020
Anyone not living under a rock is aware how much technology changed peoples’ lives in the last decade. Some of these major trends include:
Smart phones
Social media
E-commerce
Cloud computing
What do all the trends have in common? Big tech disproportionately benefitted from all these trends and commanded tremendous market share in this areas. This great graph from an article in MarketWatch demonstrates the growth in total year sales and net income for big tech names - Alphabet, Apple, Amazon, Apple and Facebook. These five companies combined have grown revenues from $300 billion in 2011 to an expected $1.4 trillion by the end of 2021:
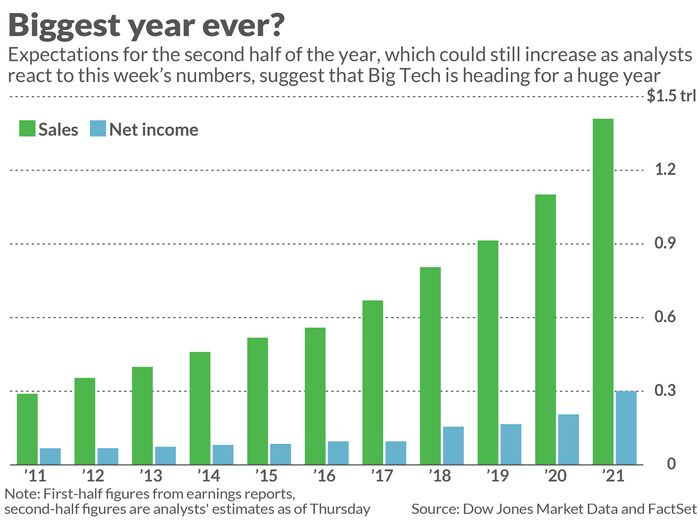
That is a stagger number put into the proper context. The total expected revenues for big tech in 2021 would equate to the entire GDP of Australia. This was completely unexpected 10 years ago.
Major U.S. Indices are Market Cap Weighted
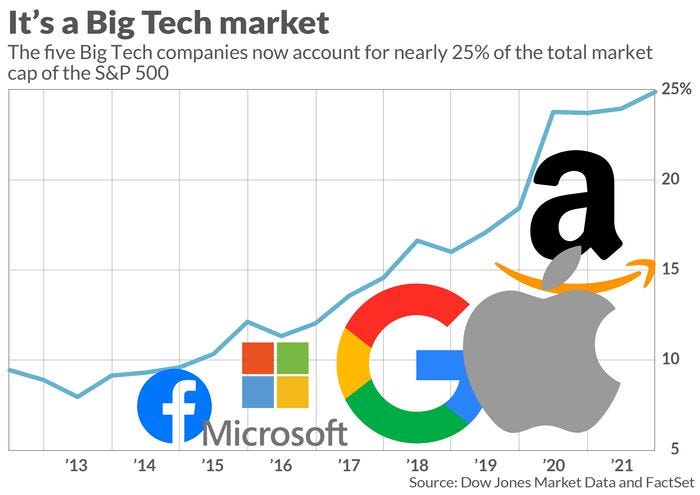
The S&P 500 is a capitalizaion-weighted stock index that includes 500 large U.S. companies. Because the index is market cap weighted, this means that the biggest stocks by market value have a larger influence on the performance of the overall index. This graph, also from MarketWatch, helps to illustrate how big tech’s influence in the S&P 500 grown over time. These weighting of these five companies in the S&P 500 has nearly tripled between 2012 and 2021:
Compare this to the MSCI EAFE (comprised of companies from developed, international countries ex U.S. such as Australia, Japan and western Europe), whose top holdings (as of 11/30/2021) are largely in consumer staples and health care companies:

Interestingly, unlike the S&P 500, the highest overall sector weights in the MSCI EAFE index are not represented by the top 10 holdings. The largest sector weightings are financials and industrials, neither of which are particularly high growth sectors:

Before you think I am picking on developed market stock performance, emerging markets have fared even more poorly. This article from Bloomberg, written just last month, highlights how emerging market stocks have plunged to a 20-year low versus U.S. Equities:

For context, the S&P 500 is up 300% since October 2010 while emerging markets were up only a measly 14%. A 14% return over a 10 year frame represents a sub 1% CAGR! The Bloomberg article also illustrates that as a result of this massive undperformance, emerging market stocks currently trade at a 40% discount to the U.S.:

Why are emerging markets also underperforming? For a number of reasons such as:
Earnings growth lagging the U.S.
Developing countries not abel to provide fiscal and monetary support to help their economies due to Covid-19 pandemic
China accounting for 42% of emerging markets and the massive, regulatory risk overshadowing the country under Xi’s leadership
While investors likely understood that emerging markets were riskier, they likely were not expecting such dismal returns compared to U.S. stocks.
Conclusion
There are likely two conclusions that one can reach based on the information provided in this blog post:
U.S. stock market performance has been so strong and this trend only seems likely to continue…why bother with investing in international stocks?
International stocks have underperformed for so long, and valuations relative to the U.S. are so low, that now is a good time to be contrarian and perhaps even go overweight international stocks
Let me be clear - I am NOT advocating that you sell all your international investments or any international ETFs/mutual funds that you may own. The purpose of this article is to illustrate and explain why some markets can outperform for extended periods of time. The divergence in performance between international and U.S. is nothing short of eye-opening. Since many U.S. investors exhibit home bias, they may not have even noticed the underperformance in international stocks.
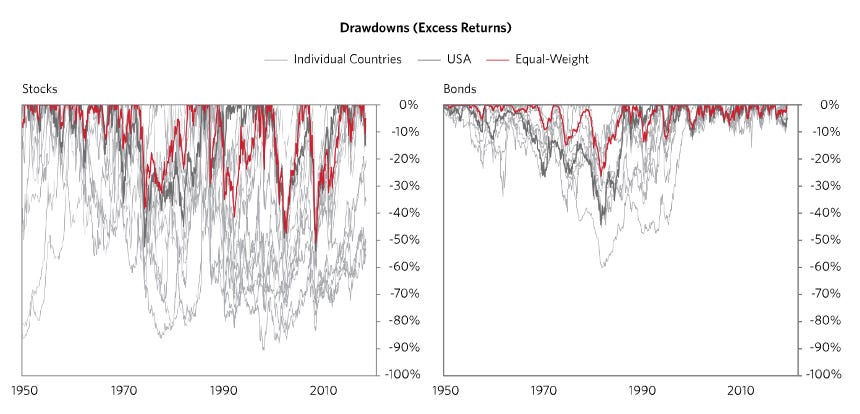
Bridgewater Associates, run by famed investor Ray Dalio, wrote an article in 2019 titled Geographic Diversification Can Be a Lifesaver, Yet Most Portfolios are Highly Geographically Concentrated. As the title suggests, geographic diversification has historically been very important for investors. Portfolio diversification across geographies, or as Bridgwater calls it, an equal-weight portfolio (red color in graph below), has helped considerably with minimizing drawdowns in both stocks and bonds:
In the past century, investors with geographically concentrated wealth have seen their portfolios get wiped out - just look at Russia or Germany in the early 20th century. Bridgewater goes on to make the case that diversification will be even more important in the future for a number of reasons including:
The world will become less correlated as countries like China rise in power
The risk of global conflict increases the chance of divergent outcomes
Low asset yields make diversification and efficient risk-taking even more important.
For those interested in economic history it is great read, but in the interest of brevity I will let readers decide if they want to examine the article further.
Despite recent outperformance by the U.S. stock market, and if history is any indicator, investors are likely better off allocating some percentage of their assets to international stocks. If anything, the case for for active equity management may be stronger for international investing given that the largest indices are underweight high growth sectors.